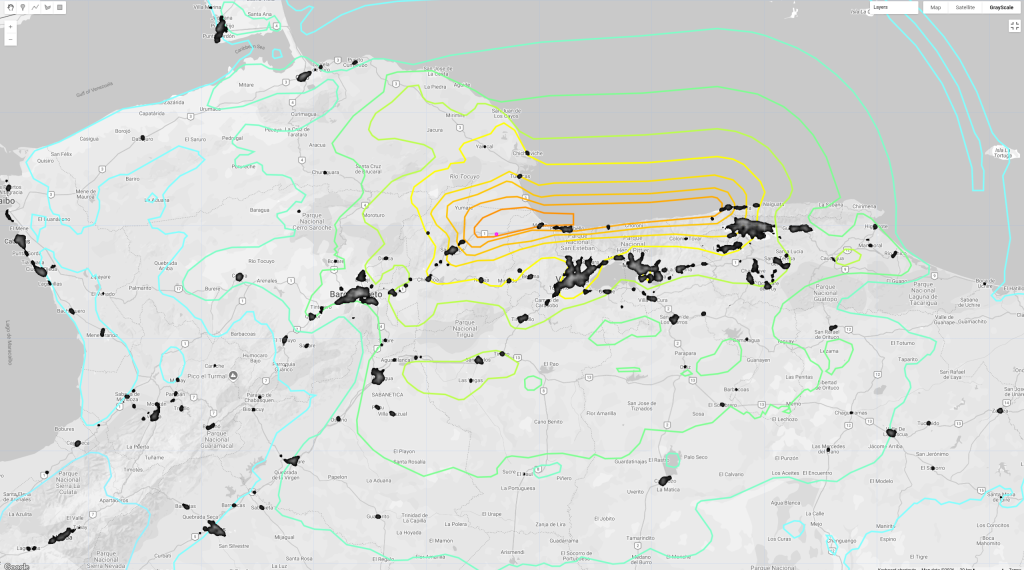
On June 24, 2026, northern Venezuela was struck by a powerful pair of consecutive earthquakes, a major M7.2 foreshock followed closely by a massive M7.5 mainshock. When disasters of this scale hit, the immediate question for responders and researchers is always the same: Where is the population most severely impacted?
To answer this, I wanted to build a rapid visual assessment tool. In this post, I’ll walk through how I mapped the USGS ShakeMap shaking intensity contours directly over the Google Open Buildings dataset using Google Earth Engine (GEE).
As someone who was proud to work on the Google Open Buildings project, it’s still amazing to see the potential impact of the dataset now over three years old. (V1 is from 2023)
Ingesting the Seismic Data
I parsed the official USGS GeoJSON contours for both events and loaded them into GEE.
// Style USGS contours server-side
var styleContours = function(featureCollection) {
  var styled = featureCollection.map(function(feat) {
    var color = ee.String(feat.get('color'));
    return feat.set({
      'style': {
        color: color,
        width: 3.5 // Bold lines for visibility
      }
    });
  });
  return styled.style({styleProperty: 'style'});
};

Map.addLayer(styleContours(mainshockFC), {}, 'USGS M7.5 Mainshock Contours');
Dual-Scale Building Visualizations
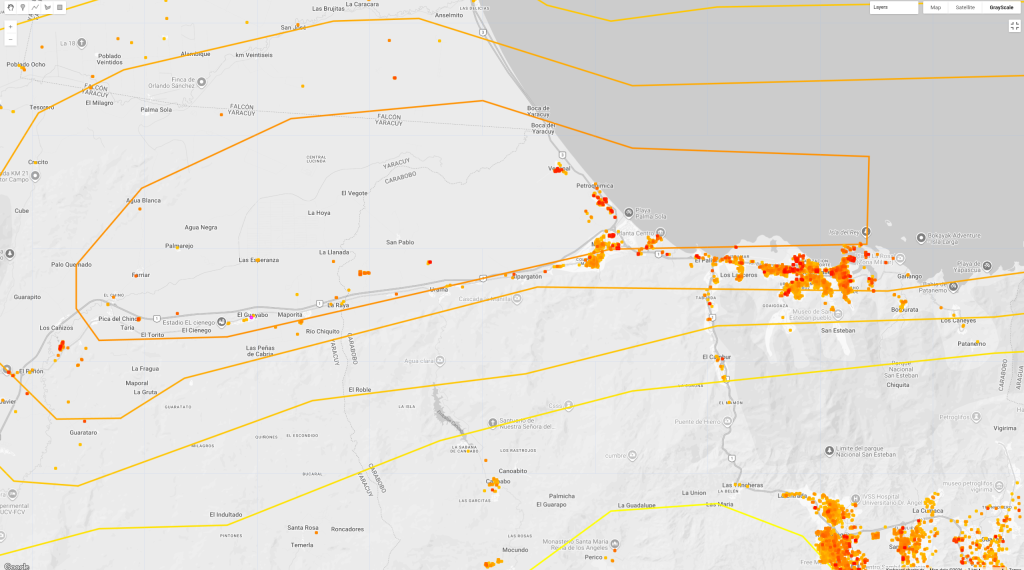
I used the Google Open Buildings Temporal V1 dataset (specifically using the 2023 mosaic) and split the representation into two layers:
- Regional Scale (Heatmap): A smooth settlement density heatmap generated
- Local Scale (Footprints): Diliated building footprints and height rasters.
// Load Open Buildings V1
var openBuildingsCol = ee.ImageCollection("GOOGLE/Research/open-buildings-temporal/v1");
var buildings2023 = openBuildingsCol.filter(ee.Filter.calendarRange(2023, 2023, 'year')).mosaic();
var presence = buildings2023.select('building_presence');

// A. Regional Exposure Heatmap
var densityRegional = presence.focalMean({radius: 1500, units: 'meters', kernelType: 'circle'});
var maskedDensity = densityRegional.updateMask(densityRegional.gt(0.05));

Map.addLayer(maskedDensity, {
  min: 0.05,
  max: 0.6,
  palette: ['#ffeb3b', '#ff9800', '#f44336'],
  opacity: 0.55
}, 'Urban Exposure Density (Regional Hotspots)');
Key Takeaway: Morón and Puerto Cabello
When you look at the final map, the intersection of shaking energy and human habitation becomes immediately clear.
The epicenters of both the M7.2 and M7.5 events were located right on the coast of the Carabobo state. When overlaying the building density hotspots, Morón and Puerto Cabello stand out as the two largest and most vulnerable urban centers directly within the highest shaking intensity zones. Puerto Cabello’s dense port infrastructure and residential zones align with the peak acceleration contours.
Data Sources & Credits:
- Earthquake Contours: USGS ShakeMap Program (Events us6000t7zp & us6000t7zc)
- Settlements: Google Research Open Buildings Temporal V1
- Engine: Google Earth Engine