Category: News

  • Mapping the Human Exposure of the Venezuela Earthquake Doublet with Earth Engine and Google Open Buildings

    On June 24, 2026, northern Venezuela was struck by a powerful pair of consecutive earthquakes, a major M7.2 foreshock followed closely by a massive M7.5 mainshock. When disasters of this scale hit, the immediate question for responders and researchers is always the same: Where is the population most severely impacted?

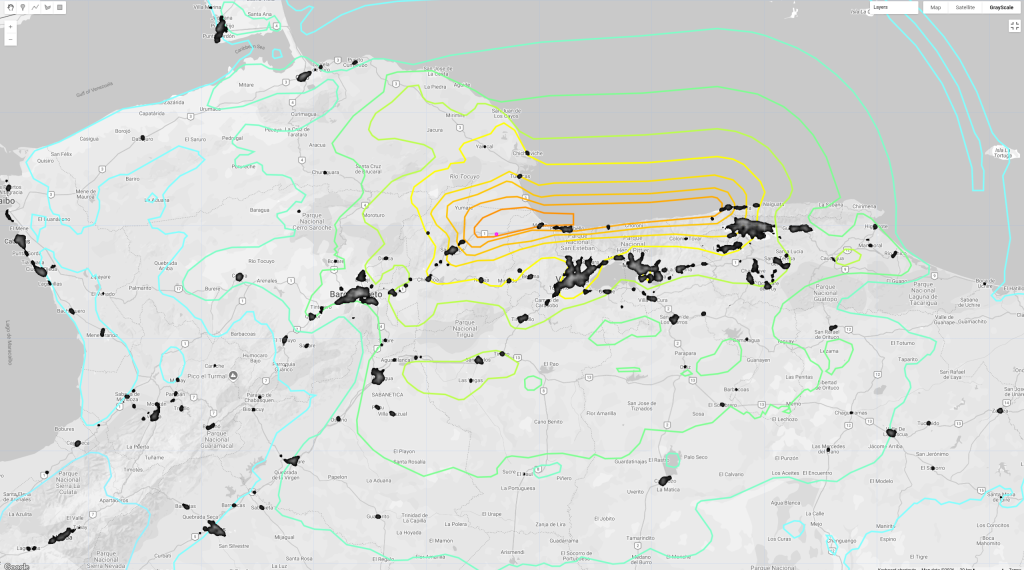
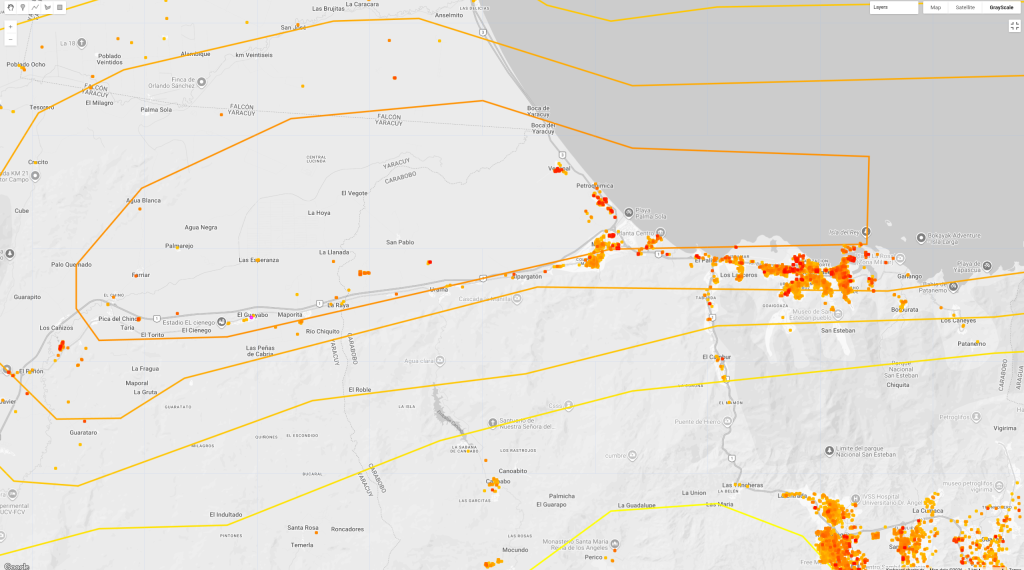
    To answer this, I wanted to build a rapid visual assessment tool. In this post, I’ll walk through how I mapped the USGS ShakeMap shaking intensity contours directly over the Google Open Buildings dataset using Google Earth Engine (GEE).

    As someone who was proud to work on the Google Open Buildings project, it’s still amazing to see the potential impact of the dataset now over three years old. (V1 is from 2023)


    Ingesting the Seismic Data

    I parsed the official USGS GeoJSON contours for both events and loaded them into GEE.


    Dual-Scale Building Visualizations

    I used the Google Open Buildings Temporal V1 dataset (specifically using the 2023 mosaic) and split the representation into two layers:

    • Regional Scale (Heatmap): A smooth settlement density heatmap generated
    • Local Scale (Footprints): Diliated building footprints and height rasters.

    Key Takeaway: Morón and Puerto Cabello

    The epicenters of both the M7.2 and M7.5 events were located right on the coast of the Carabobo state. When overlaying the building density hotspots, Morón and Puerto Cabello stand out as the two largest and most vulnerable urban centers directly within the highest shaking intensity zones. Puerto Cabello’s dense port infrastructure and residential zones align with the peak acceleration contours.


    Data Sources & Credits:

  • The experimental Linux terminal app on a Pixel phone

    Don’t you agree this is pretty neat? 🐧
    As a longtime Linux user (~20y), I got excited to see a native Debian environment land on Android 15.
    With regards to accessibility, a student can learn command line basics, debug while in transit, or even manage AI agents from their phone. I think having an isolated terminal in your pocket is a game changer.
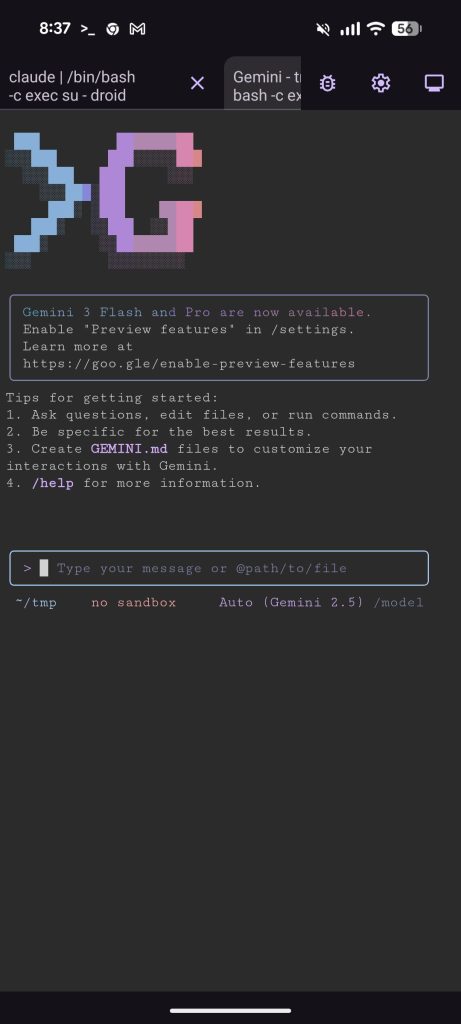
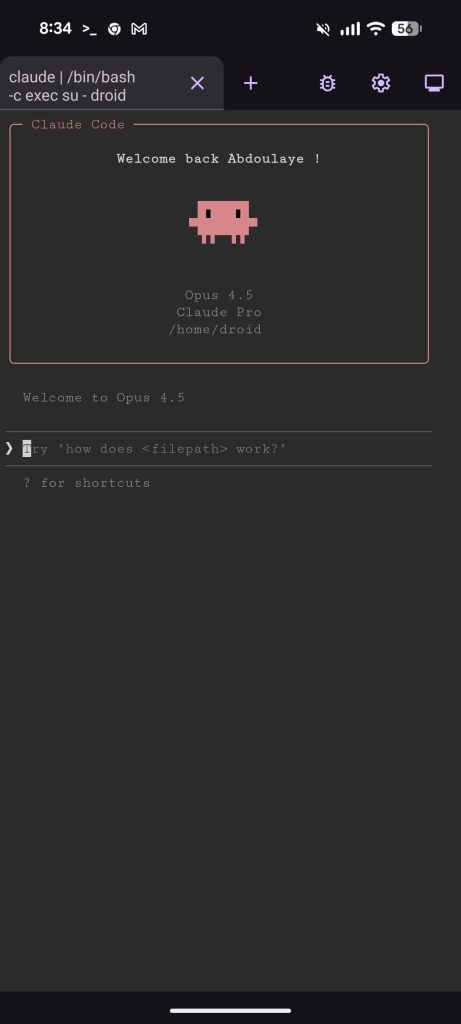
    I tried both Google Gemini CLI and Claude Code on my device and it works quite well. No hacking or rooting required.
    For now, this is limited to Pixel devices, but I’m hoping we see this in more devices across the ecosystem.
    If you have a Pixel, here is how to unlock it:
    1)Enable Developer Options.
    2)Toggle on “Linux development environment.”
    3) Install whatever you need (example)
    Open the terminal and run:
    sudo apt install npm
    npm install -g @google/gemini-cli

    https://developer.android.com/about/versions/15/release-notes#linux-development-environment

  • First Images from ESA Biomass Satellite

    Absolutely stunning images of Gabon and Tchad from the European Space Agency’s (ESA) Biomass satellite.

    The first image shows the Ivindo River in Gabon, stretching from the DRC border all the way to Makoukou in the Ogooué-Ivindo province. This region is known for its dense forests. Typically, when we look at forests from above, all we see are the treetops. However, Biomass uses a special kind of radar, called P-band radar, which has the ability to penetrate through the forest canopy to reveal the terrain below. This means it can measure all the woody material—the trunks, branches, and stems—offering a much more complete picture than ever before.

    The second image features the Tibesti Mountains in northern Chad, and it looks like something straight out of space. Here, the radar demonstrates its ability to see up to five meters beneath dry sand. This opens up fascinating possibilities for mapping and studying hidden features in deserts, such as ancient riverbeds and lakes that have long been buried. Such insights are incredibly valuable for understanding Earth’s past climates and even for locating vital water sources in arid regions.

    It’s an exciting time as our ability to collect information about Earth continues to advance, especially with progress in remote sensing and Artificial Intelligence (AI). The rise of geospatial AI, in particular, is opening up fascinating new avenues for understanding our planet and opening new fields of research.

    If you’re a student considering a career in understanding Earth through technology, leveraging AI. In my opinion, this field presents some interesting opportunities. You can explore more about the amazing Biomass mission on the official ESA website:

    https://www.esa.int/Applications/Observing_the_Earth/FutureEO/Biomass/Biomass_satellite_returns_striking_first_images_of_forests_and_more

    Image credit: ESA

  • 10Gbps Over 1km: Taara’s Incredible Silicon Photonics Breakthrough

    I find this simply incredible. This new Taara chip is smaller than a fingernail, yet it can transmit data at 10 gigabits per second over a 1KM DISTANCE! 🤯🤯🤯

    “In tests at the Moonshot Factory labs, our team has successfully transmitted data at 10 Gbps (gigabits per second) over distances of 1 kilometer outdoors using two Taara chips. We believe this is the first time silicon photonics chips have transmitted such high-capacity data outdoors at this distance. And this is just the beginning. We plan to extend both the chip’s range and capacity by creating an iteration with thousands of emitters.”

    The previous version of Taara, the light bridge, steered light beams mechanically using mirrors and sensors. Now, they’ve shrunk it to the size of a coin, replacing much of the hardware with software.
    I’ve been a huge fan of this project for many years, and it’s exciting to see this ‘moonshot’ turning into reality. It can bring high-speed internet to underserved regions, change how data centers operate and so much more. Huge congrats to the Taara team!

    https://x.company/blog/posts/taara-chip