I started this exercise wondering how Google DeepMind’s AlphaEarth embeddings dataset would compare to historical fire data. It turned out to be a really interesting experience.
I learned there are a lot of fires in central Africa—especially Southern DRC, Angola, and Zambia—far more than I expected. Apparently, some fires are set on purpose as part of an agricultural practice.
Still, it’s worrying to see so many fires, especially when you think about the ones recently in the news across North America and Southern Europe. Funny enough, I hadn’t even noticed the pattern until my 9-year-old son pointed out the region to me while we were checking the map.
I find the AlphaEarth dataset fascinating, as you can see a clear correlation between the type of landscape and where fires happen.
I used Gemini to generate the boilerplate JavaScript for Google Earth Engine, and I had this visualization running in a few minutes. Gemini is quite good at generating JavaScript for Google Earth Engine.
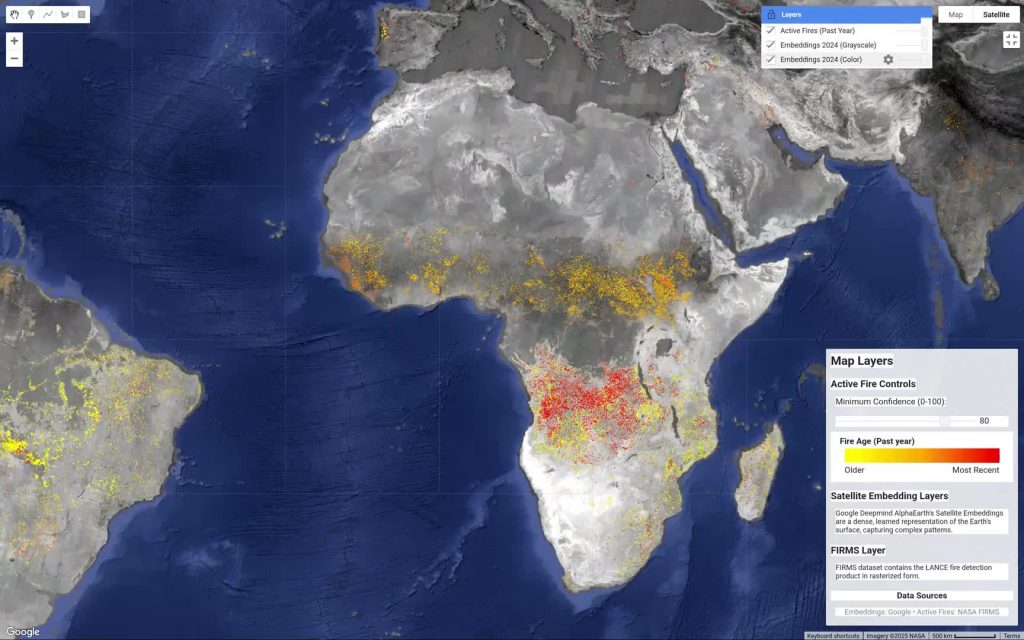
Video caption: The colorful background is an AI’s unique “fingerprint” of our planet, where landscapes with similar characteristics get similar colors. Overlaid on top, the yellow/orange/red dots are real fire hotspots detected by NASA satellites over the last year with a confidence level set at 80%.
Dataset Credits:
- Satellite Embeddings V1: Google Earth Engine / Google DeepMind
Link: https://developers.google.com/earth-engine/datasets/catalog/GOOGLE_SATELLITE_EMBEDDING_V1_ANNUAL#description - Active Fires (FIRMS): NASA LANCE / EOSDIS
Link: https://developers.google.com/earth-engine/datasets/catalog/FIRMS#description
Code I Used:
Link: https://code.earthengine.google.com/de7448ec0c632156d18902053bbda78f
Video caption: The colorful background is an AI’s unique “fingerprint” of our planet, where landscapes with similar characteristics get similar colors. Overlaid on top, the yellow/orange/red dots are real fire hotspots detected by NASA satellites over the last year with a confidence level set at 80%.