Active volcanoes are some of the most dynamic features on Earth, yet monitoring them on the ground is expensive and dangerous. I’m not very familiar with professional satellite observation platforms, but I imagine they are resource-intensive and require manual checking.
So I asked myself: could I build a cheap, agentic detection system that runs on a cloud micro-instance and give it a fancy name like AVED (Autonomous Volcanic Eruption Detector)? It is a lightweight, event-driven pipeline that integrates Google Earth Engine (GEE), Python systemd services (acting like a crontab), and Telegram to alert me within a few hours when a volcano shows signs of unrest.
Here is a look at how the system works under the hood and how it combines three distinct satellite instruments.
The Architecture: Multi-Sensor Fusion
Instead of querying heavy imagery continuously (which consumes massive processing quotas and storage), AVED operates on a two-stage, event-driven lifecycle.
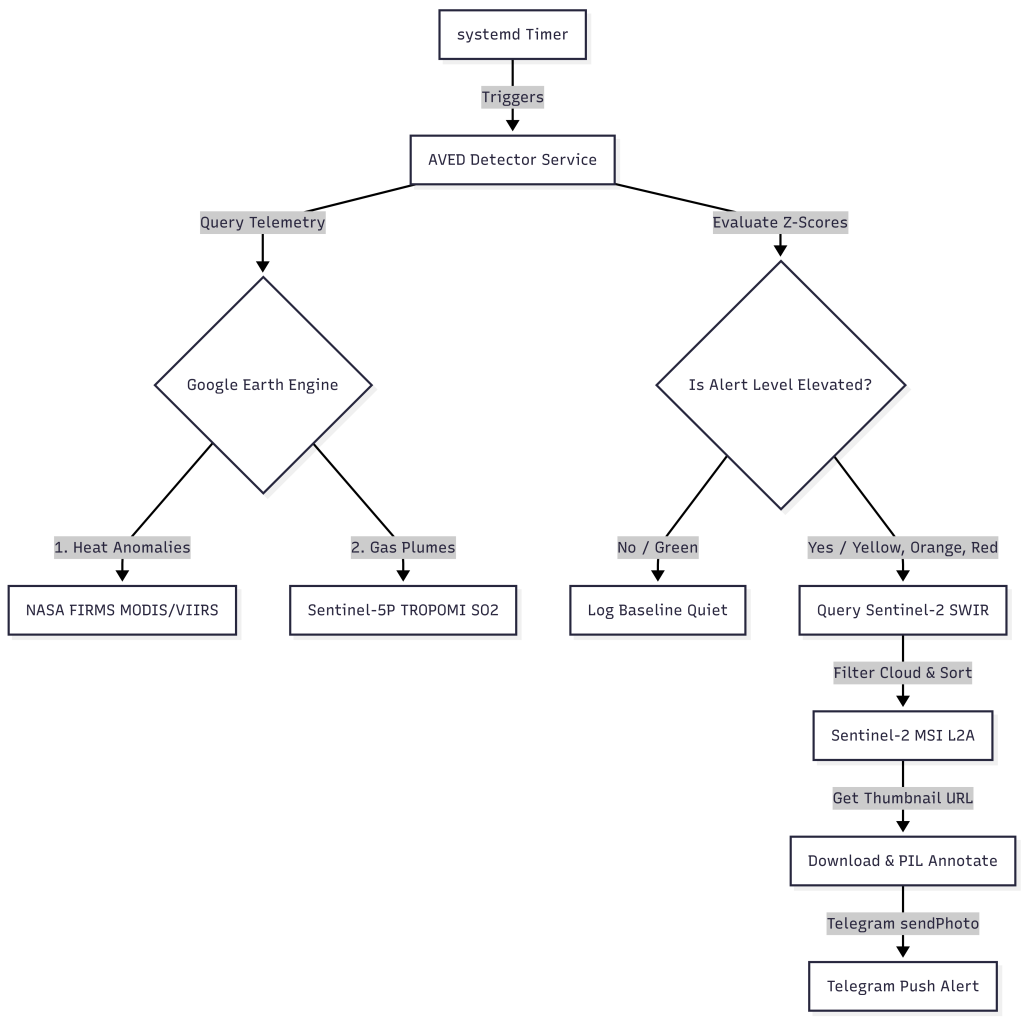
Stage 1: The Near-Real-Time Trigger (FIRMS & Sentinel-5P)
The detector checks volcano coordinates periodically (via systemd timers) by querying GEE for two datasets:
- NASA’s FIRMS (Thermal Hotspots): Uses MODIS and VIIRS satellite sensors. It detects thermal anomalies and updates multiple times a day with a 3 to 12-hour latency.
- Copernicus Sentinel-5P (Atmospheric SO₂): Measures atmospheric Sulfur Dioxide (SO₂) columns daily with a 1 to 2-day latency.
We evaluate this telemetry using statistical Z-scores against a 30-day baseline. If the Z-score exceeds thresholds (indicating abnormal heating or gas emission), the pipeline transitions to Stage 2.
Stage 2: Contextual Visual Verification (Sentinel-2 SWIR)
Only when an alert is flagged (Level YELLOW, ORANGE, or RED) does the agent execute the heavier imaging pipeline:
- The Instrument: It queries Sentinel-2 (MSI) Level-2A surface reflectance data. Sentinel-2 has a 5-day revisit cycle.
- Cloud Filtering & Sorting: It filters the last 30 days of data over the caldera, sorts them by
CLOUDY_PIXEL_PERCENTAGE, and grabs the clearest image. - The Bands: We select bands
B12(Short-Wave Infrared 2),B8(Near-Infrared), andB4(Red). In this false-color configuration, vegetation shows up as vibrant green, volcanic rock as dark brown/black, and active hot spots (lava lakes or flows) glow in bright red/orange/yellow.
Auto-Annotating the Output
To make the alert actionable, the script downloads the GEE thumbnail and uses Pillow (PIL) to draw a semi-transparent dark banner at the bottom with crucial metadata:
# Draw banner & text using PIL
banner_height = 50
draw.rectangle([0, height - banner_height, width, height], fill=(0, 0, 0, 160))
draw.text((15, height - banner_height + 5), f"{volcano_name} - Satellite View", fill="white")
draw.text((15, height - banner_height + 25), f"Captured: {date_str} (Cloud: {cloud_pct:.1f}%) | Sentinel-2 SWIR", fill="lightgrey")
Below is the verified output generated during the active alert for Mt. Nyiragongo in the DRC:
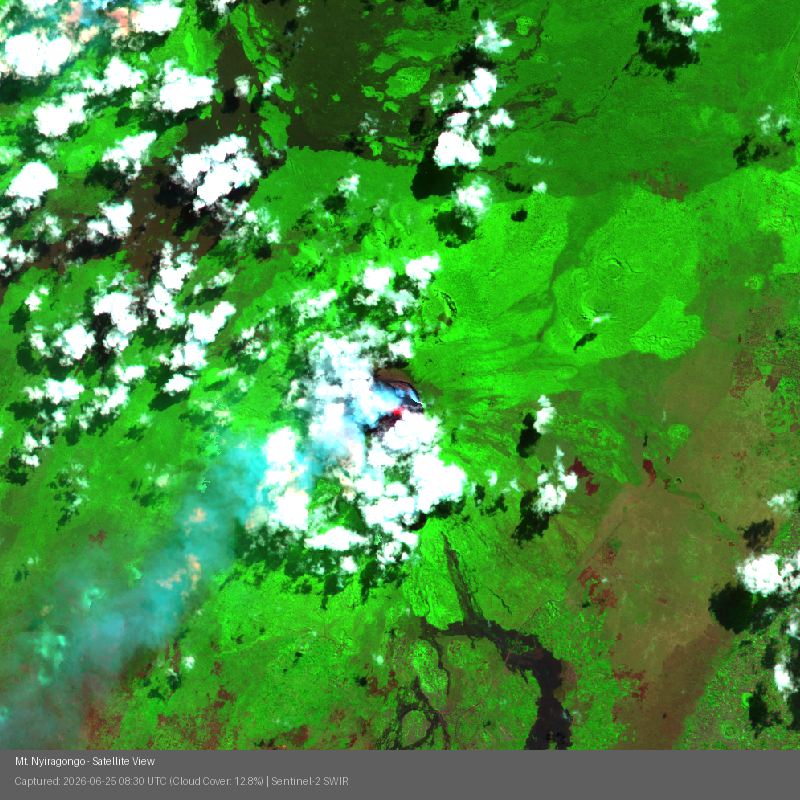
Can you spot active lava lake glowing in red at the crater center? You should also see the gaseous sulfur plume drifting towards the southwest.
Production Verification
I deployed the system to my Cloud instance on Google Cloud. Shortly after activation, the pipeline flagged an elevated YELLOW alert for Mt. Nyiragongo in the Democratic Republic of the Congo.
The logs show the automated execution from start to finish:
2026-06-28 20:19:38 [INFO] Fetching telemetry for Mt. Nyiragongo...
2026-06-28 20:19:39 [INFO] Elevated alert level YELLOW for Mt. Nyiragongo. Fetching satellite image...
2026-06-28 20:19:43 [INFO] HTTP Request: GET https://earthengine.googleapis.com/v1/.../thumbnails/...:getPixels "200 OK"
2026-06-28 20:19:44 [INFO] Successfully annotated and saved volcano image for Mt. Nyiragongo.
2026-06-28 20:19:46 [INFO] Telegram alert with photo sent successfully for Mt. Nyiragongo.
Why This Was Fun
By combining high-cadence thermal monitoring with high-resolution multispectral imagery on-demand, this architecture built my first smart, resource-efficient remote sensing agent.
Data Credit
Copernicus Sentinel-2 (https://developers.google.com/earth-engine/datasets/catalog/COPERNICUS_S2_SR_HARMONIZED)
Sentinel-5P SO₂ (https://developers.google.com/earth-engine/datasets/catalog/COPERNICUS_S5P_OFFL_L3_SO2)
NASA’s FIRMS (https://developers.google.com/earth-engine/datasets/catalog/FIRMS) All datasets processed via Google Earth Engine.